Analytics and Reporting Screen Visual

ANALYTICS & REPORTING

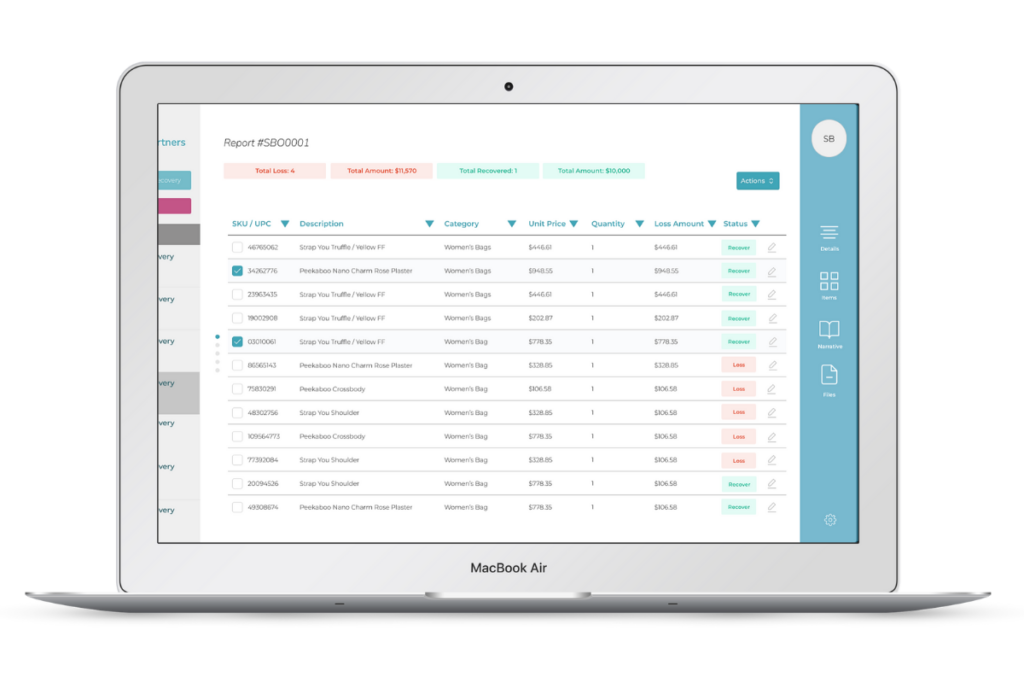
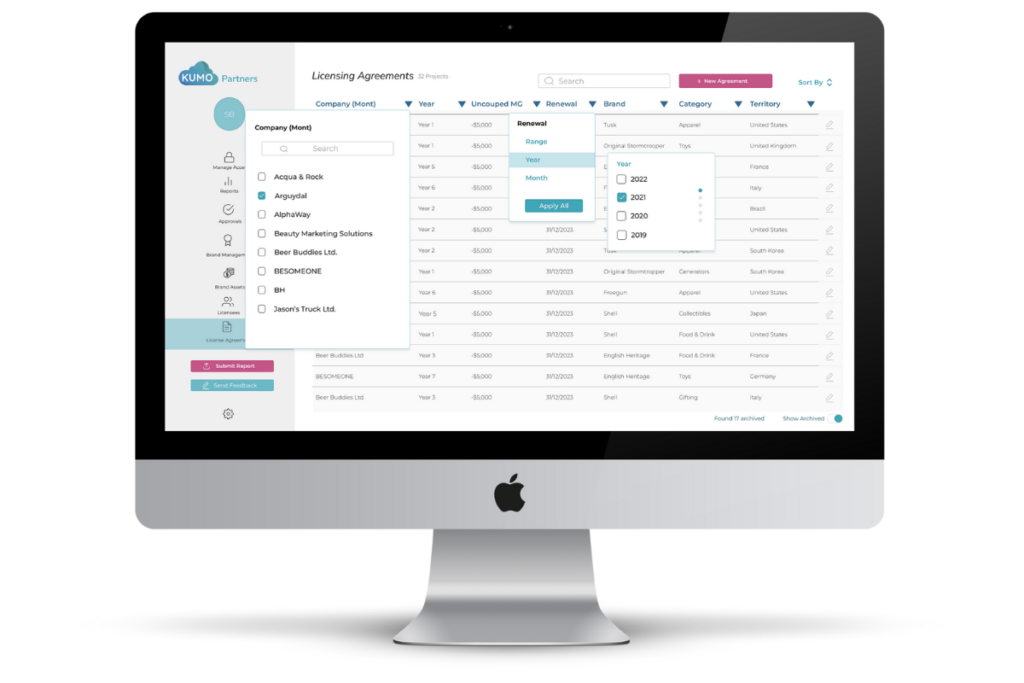
Intelligent Analytics & Reporting Built for Scaling Your Business

We build interactive reporting dashboards that create a visual representation of your data. Our solutions enable your organization to make better business decisions – leading to more profitability for you business.

There’s Truth in Numbers

Don’t Lose Sight of Yours

Solutions Offered

  • Connect directly to any data source
  • Bring data from separate systems into one centralized location
  • Interactive reporting dashboards
  • Visual representation of your data
  • Create Key Performance Indicators (KPIs) to track business performance

Technologies Used

  • Any third party API
  • Power Automate
  • Power BI Dashboard
  • Power Query
  • SharePoint

Make Better Decisions

Our solutions enable your organization to make better business decisions — leading to more profitability for your business.

power bi
Reporting Dashboard Licensing

Improved Insights

Receive robust analysis of company performance, leading to more effective personnel decisions.

Centralized Reporting

Receive a single report for reviewing employee performance and tracking company performance.

Centralized Reporting and Analytics Dashboard

Let’s Get to Work

set up a call today!

Kumo team working picture